
SalesFlow
The Problem
Retail sales data is rarely clean by the time it reaches a spreadsheet or dashboard: malformed dates, negative quantities, unknown categories, and duplicate order IDs slip in constantly, and most ad-hoc scripts either crash on them or silently drop rows without saying why. SalesFlow treats that as a first-class problem rather than an edge case, a retail sales ETL and analytics pipeline that turns raw, imperfect transaction data into clean, trustworthy business metrics, with every rejected row traceable back to a specific, human-readable reason.
My Role
Sole developer, owning the project end-to-end: schema design, validation, aggregation, persistence, the CLI, and the full test and CI setup.
Technical Decisions
Schema-driven validation with per-row quarantine
Every incoming record is validated against a strict Pydantic schema. Rows that fail, a malformed date, a negative quantity, an unknown category, a duplicate order ID, are quarantined individually with the specific validation reason attached, rather than being silently dropped or aborting the whole run. That makes data-quality issues visible and diagnosable instead of just making the numbers wrong.
A configurable data-quality gate
The pipeline refuses to proceed past validation if the proportion of bad records crosses a configurable threshold, rather than always pushing whatever survived into the reports. Reports built on top of a batch that was mostly bad data are worse than no report at all, so the gate stops bad data at the source instead of letting it flow downstream.
Pandas aggregation, dual persistence
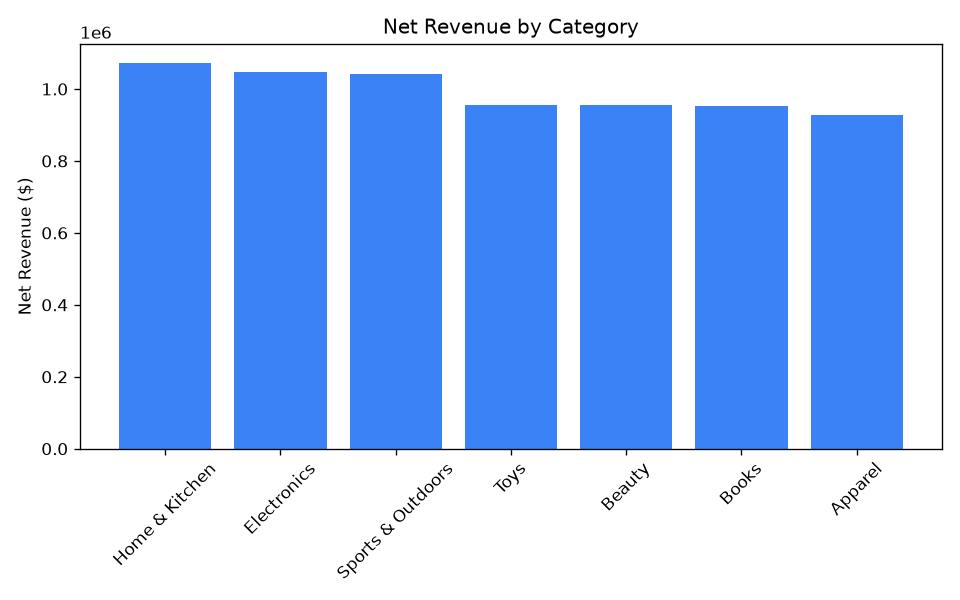
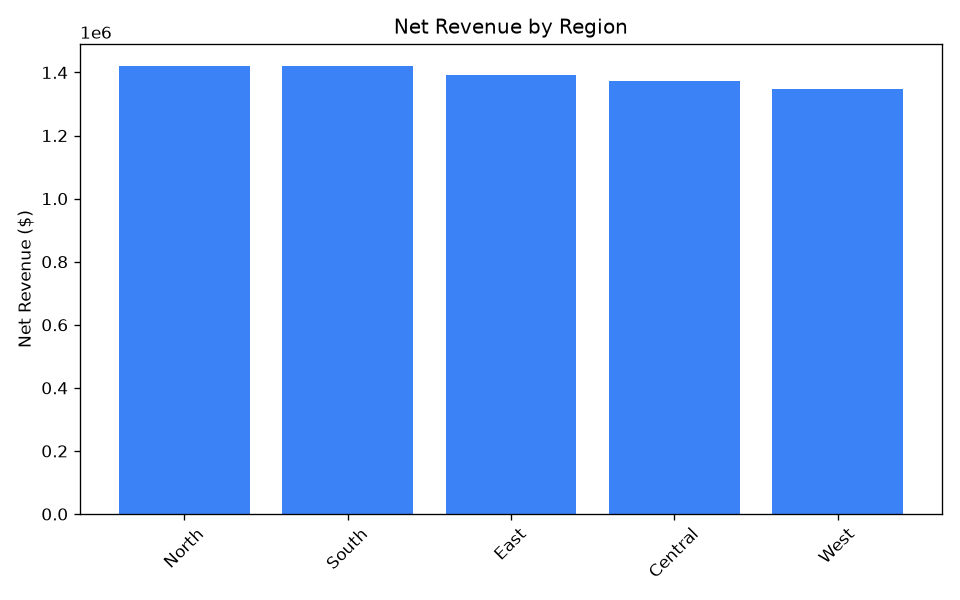
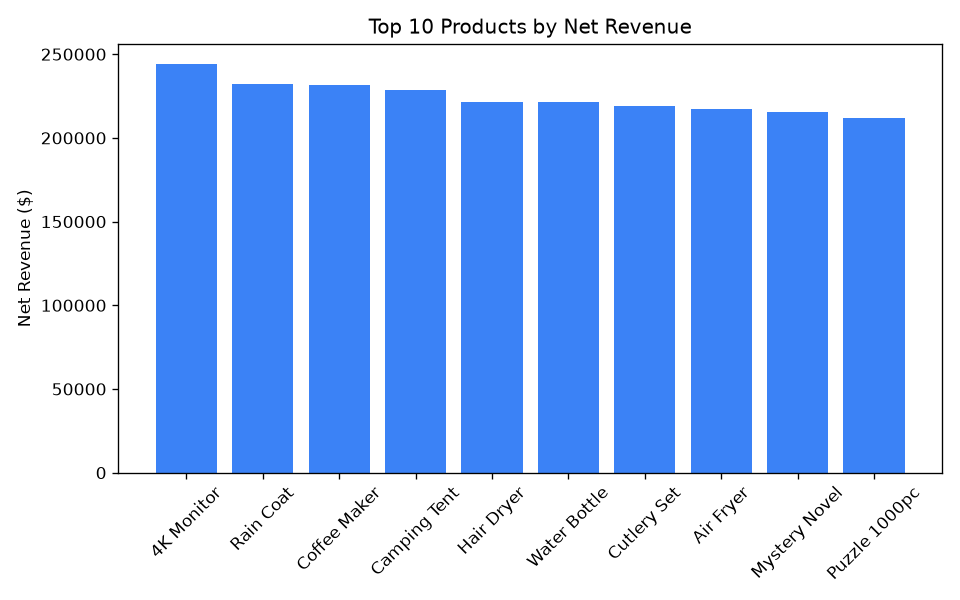
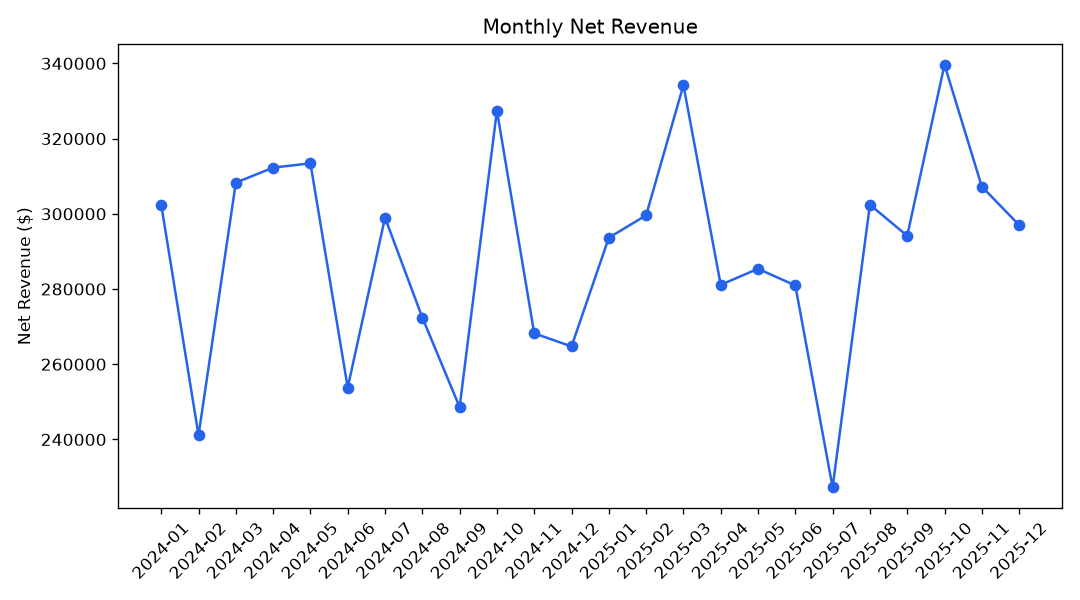
Valid records are aggregated with Pandas into monthly revenue trends and category/region product rankings, then persisted twice, to SQLite, so the results stay queryable, and to CSV, so they stay portable. matplotlib charts and an auto-generated Markdown summary report are produced from the same aggregated data, so the visual and written outputs never drift out of sync with each other.
A CLI, not a one-off script
Data generation, pipeline runs, and config inspection are all exposed through a CLI built with click and rich, so the tool can be operated the same way whether it's used interactively or from a scheduled job, rather than being a script someone has to open and edit to change behavior.
Tested and enforced like production code
27 tests covering 95% of the codebase, ruff and mypy running on every push, and GitHub Actions CI across two Python versions. The goal was to reflect how a data pipeline should actually be built and maintained in production, not just scripted once to produce a demo output.
Key Functionality
- Schema-driven validation (Pydantic) with per-row quarantine and failure-reason tracking
- Configurable data-quality gate that fails the run if too much data is bad
- Pandas-based aggregation: revenue by month/category/region, product rankings
- Persistence to SQLite (queryable) and CSV (portable), plus an auto-generated summary report
- CLI built with click + rich for data generation, pipeline runs, and config inspection
- 95% test coverage, ruff + mypy static checks, GitHub Actions CI across two Python versions
Project Information
- Category: Data Engineering / ETL Pipeline (Python)
- Type: Personal project
- Role: Solo developer
- Timeline: 2026
Project Screenshots